
Introduction:
In response to the evolving needs of Pizzabro, a leading pizza chain, we undertook the development of a comprehensive sales report dashboard. This dashboard aimed to provide actionable insights derived from sales data, facilitating informed decision-making and strategic planning for the management team
Objective:
The primary objective of this project was to create an interactive dashboard that allows Pizzabro’s management to analyze sales performance across various pizza categories, track key performance indicators (KPIs), and identify trends in customer behavior over time.
Methodology:
The project involved a multi-step process:
- Data Collection: Raw sales data was initially collected from Pizzabro’s operations and stored in Microsoft Excel format.
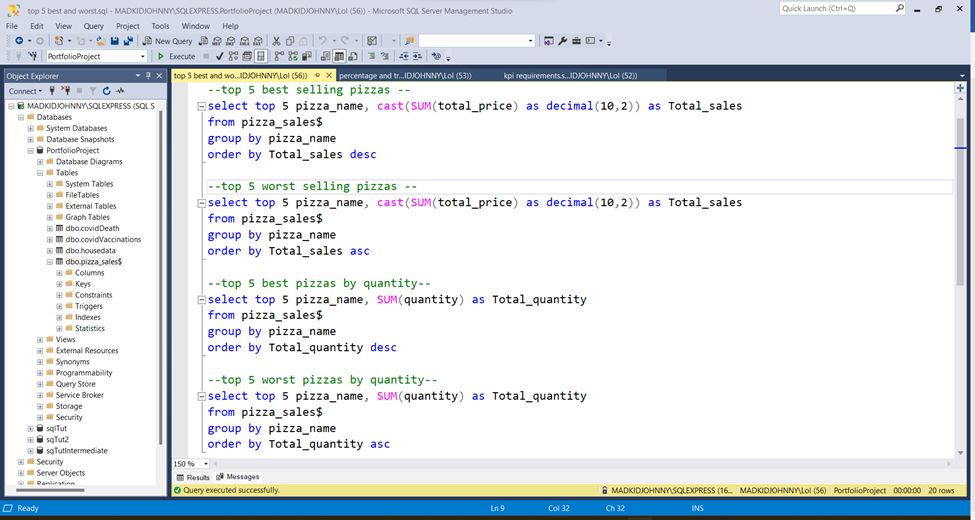
- Data Cleaning and Transformation: The collected data was cleaned and transformed using Microsoft SQL Management Server, ensuring accuracy and consistency.
- Dashboard Development: Using Tableau, we designed and developed a user-friendly dashboard with intuitive visualizations.
- Verification: The accuracy and reliability of the dashboard were validated by executing firing SQL queries to verify the integrity of visualizations.
- Client Collaboration: Throughout the development process, we collaborated closely with the client to understand their requirements and incorporate feedback iteratively.
Features:
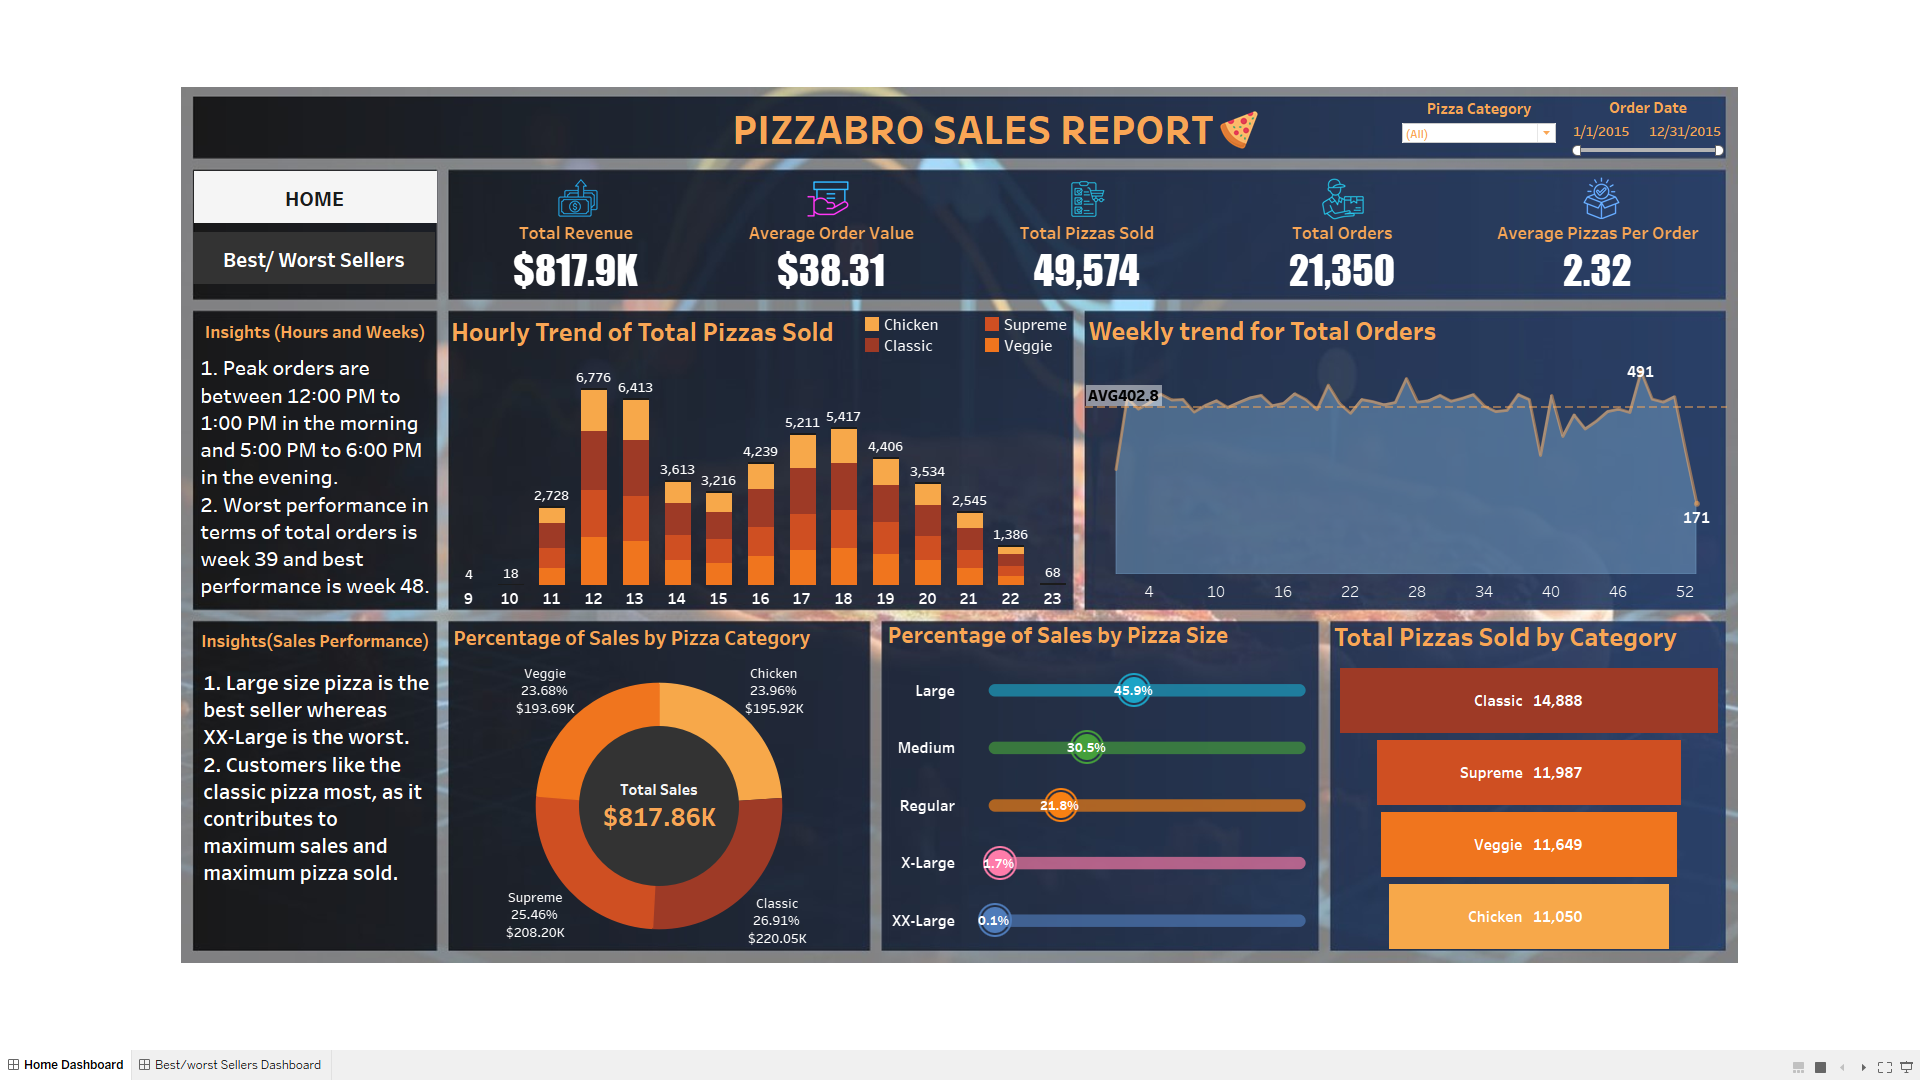
- Interactive Visualization: The dashboard provides an interactive platform for exploring sales data, enabling users to drill down into specific pizza categories, time periods, and performance metrics.
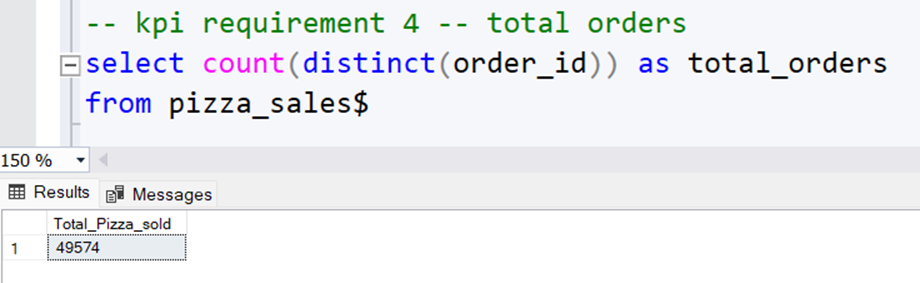
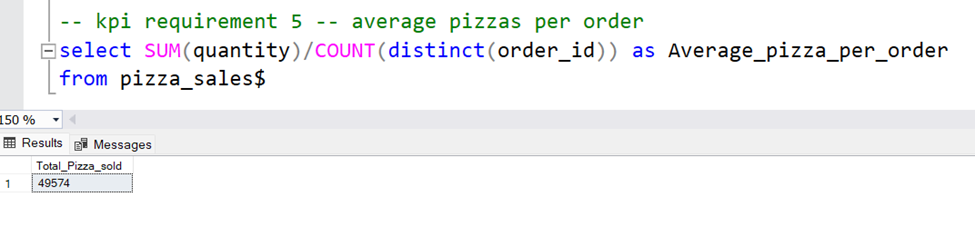
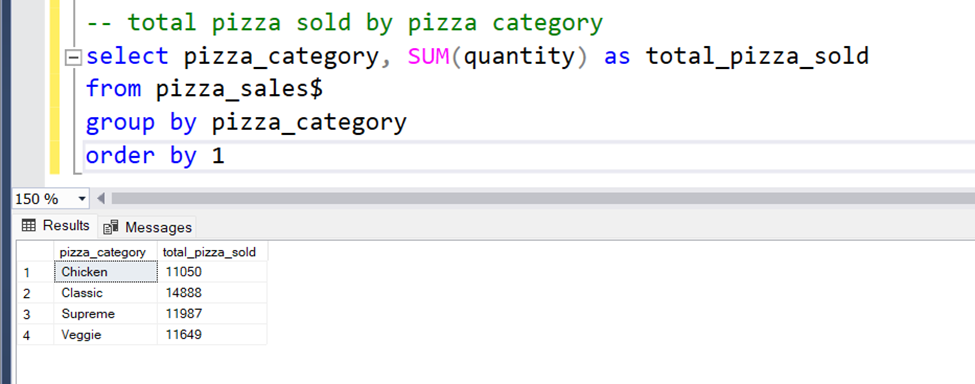
- KPI Monitoring: Key performance indicators such as total pizza sold, revenue, and total orders are prominently displayed, allowing management to monitor performance against targets.
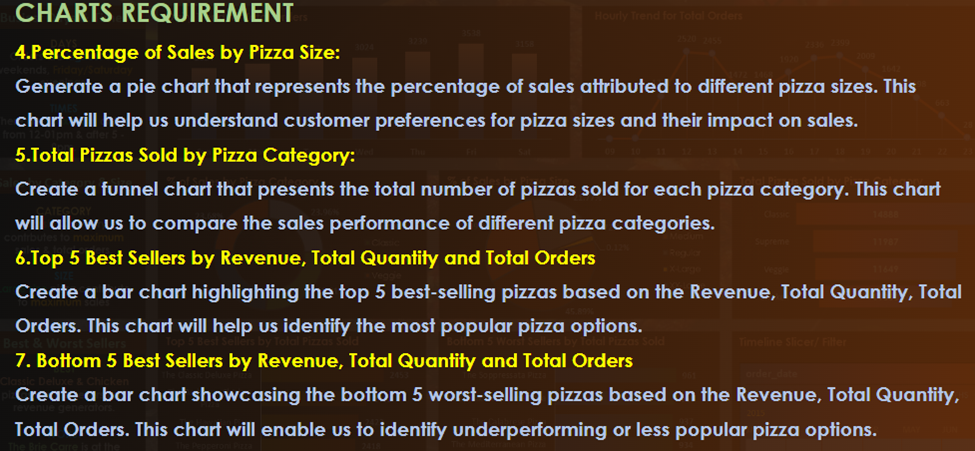
- Best and Worst Pizzas: The dashboard highlights the best-performing and worst-performing pizzas based on sales performance, facilitating product analysis and decision-making.
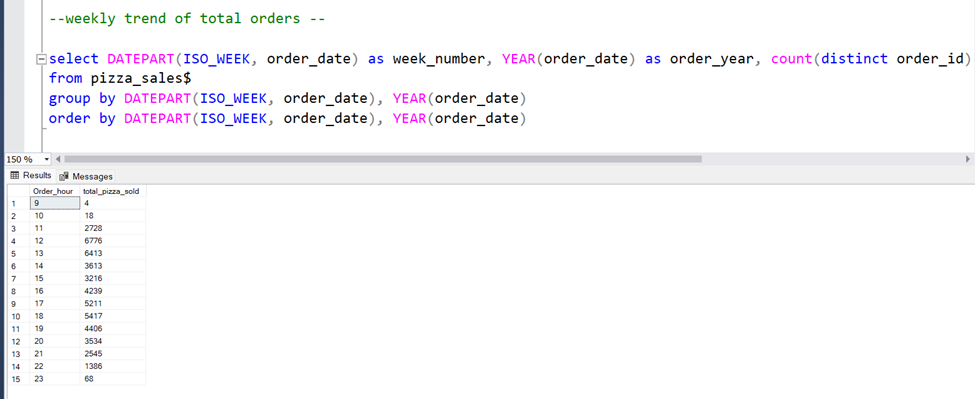
- Hourly and Weekly Trends: Hourly trends of pizza orders as well as weekly trends are visualized, providing insights into peak sales periods and seasonal variations.
Outcome:
The completion of this project resulted in the deployment of a robust sales report dashboard tailored to Pizzabro’s specific needs. Management now has access to real-time insights into sales performance, enabling them to make data-driven decisions and optimize business operations effectively.
Conclusion:
The development of the Pizzabro Sales Report Dashboard represents a significant milestone in enhancing Pizzabro’s analytical capabilities and strategic decision-making processes. Moving forward, we remain committed to supporting Pizzabro in leveraging data-driven insights to drive business growth and success.
Overview of the Data

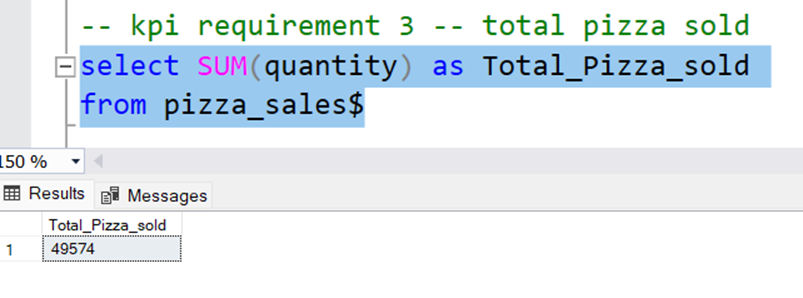
KPI’s Requirement
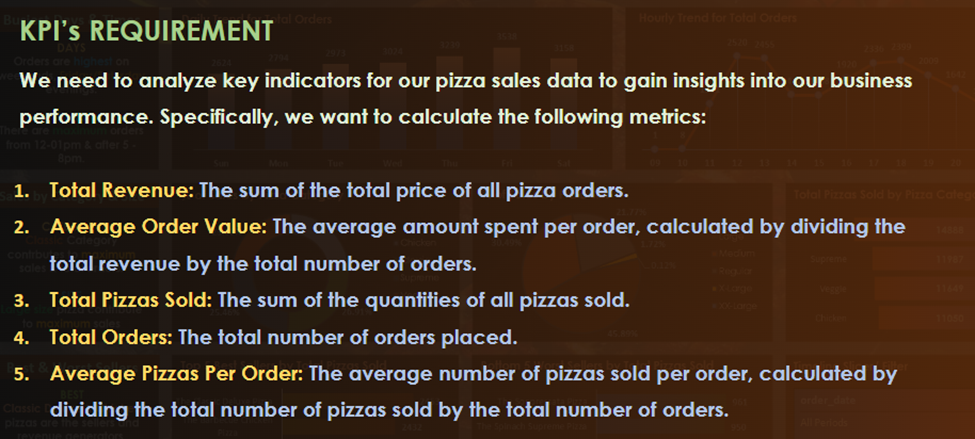
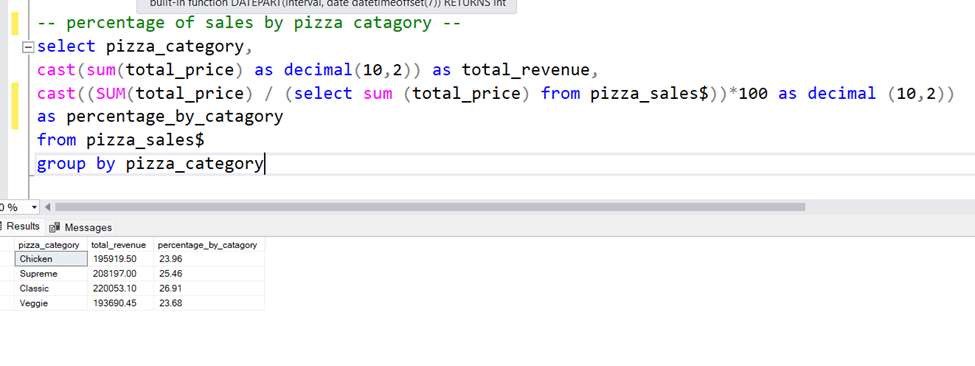
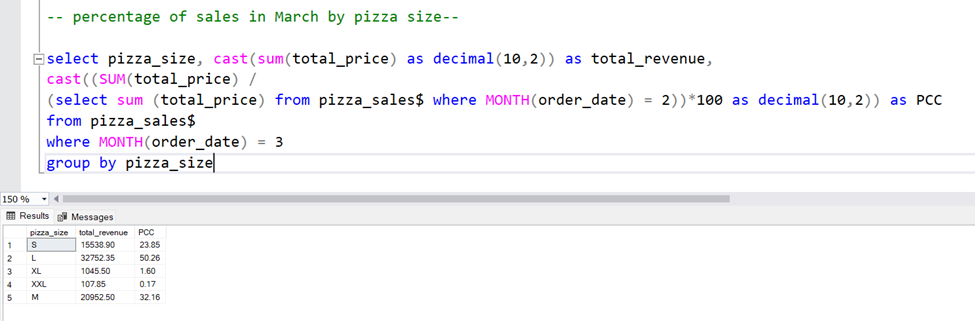
SQL Verification
1.

2.
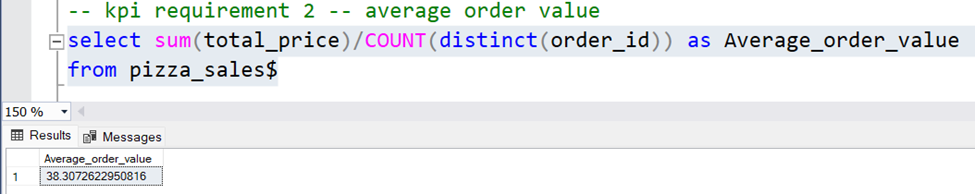
3.
4.
5.
Charts Requirement
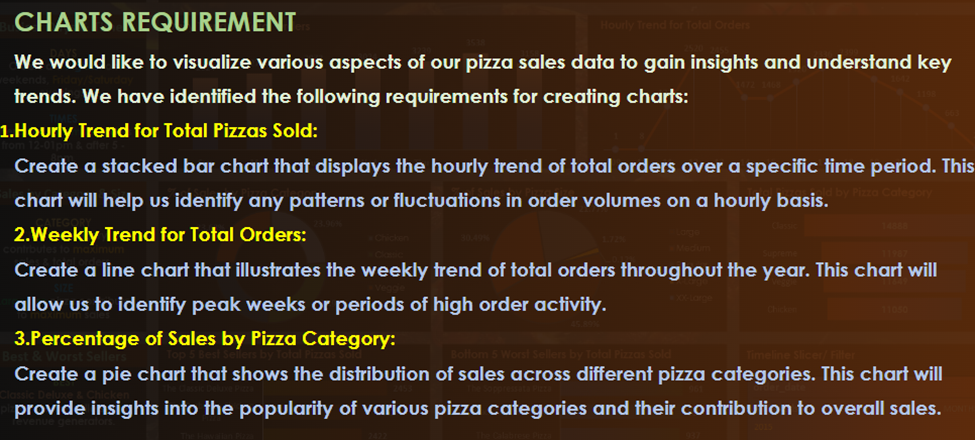
1.

2.
3.
4.
5.
Software Used:
Microsoft Excel: Microsoft Office LTSC Standard 2021
MS SQL Server: 19.3.4.0
Tableau Desktop: 2024.1